My process at:
De Correspondent
As an information designer, I support our journalistic articles with data visualizations and infographics. These can take many different forms: not just only effective conventional charts, but also visual explorations of feelings, experiences, and abstract concepts—anything that helps make the story clearer and more impactful. The core purpose is always the same: to visually strengthen the message of the journalism it accompanies.
The themes I work on range widely, from serious subjects such as politics, socio-economic inequality, and Gaza, to lighter topics like football and animals.
Information design
Datavisualisation
Example case – Digital Illiteracy 1/3
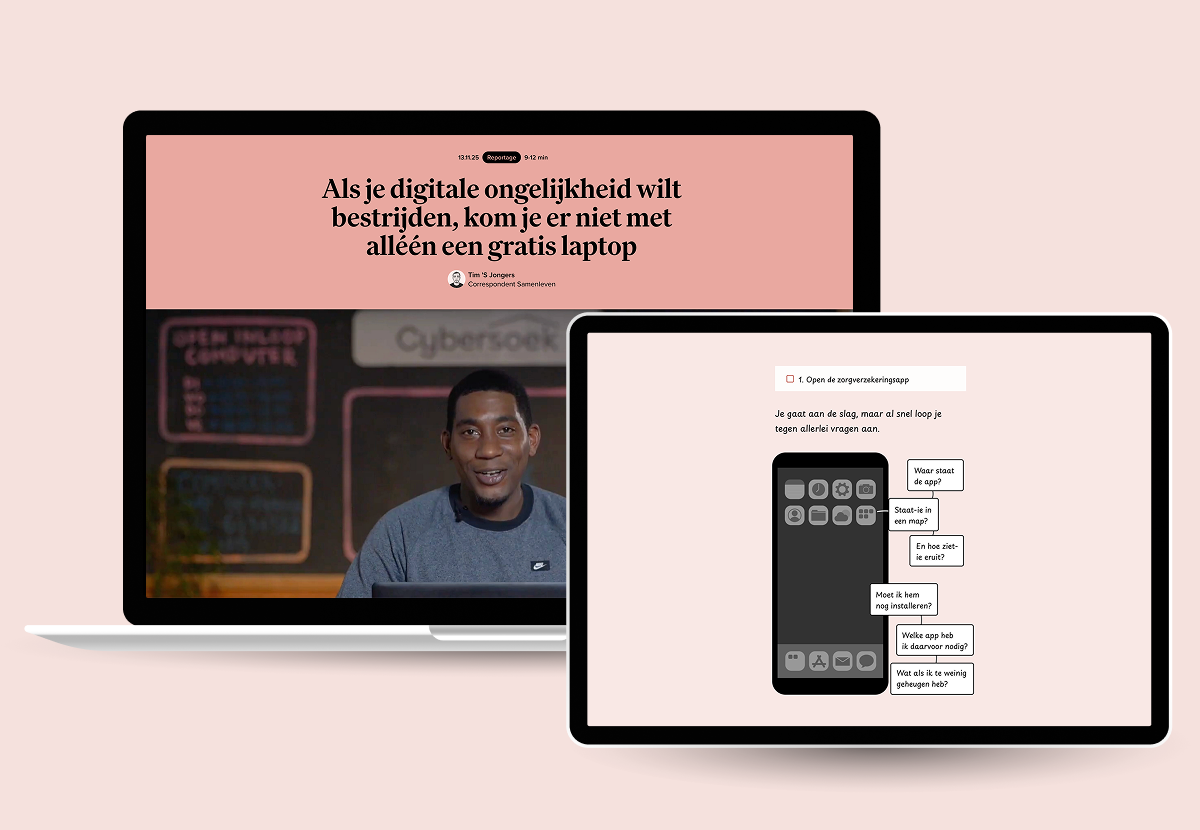
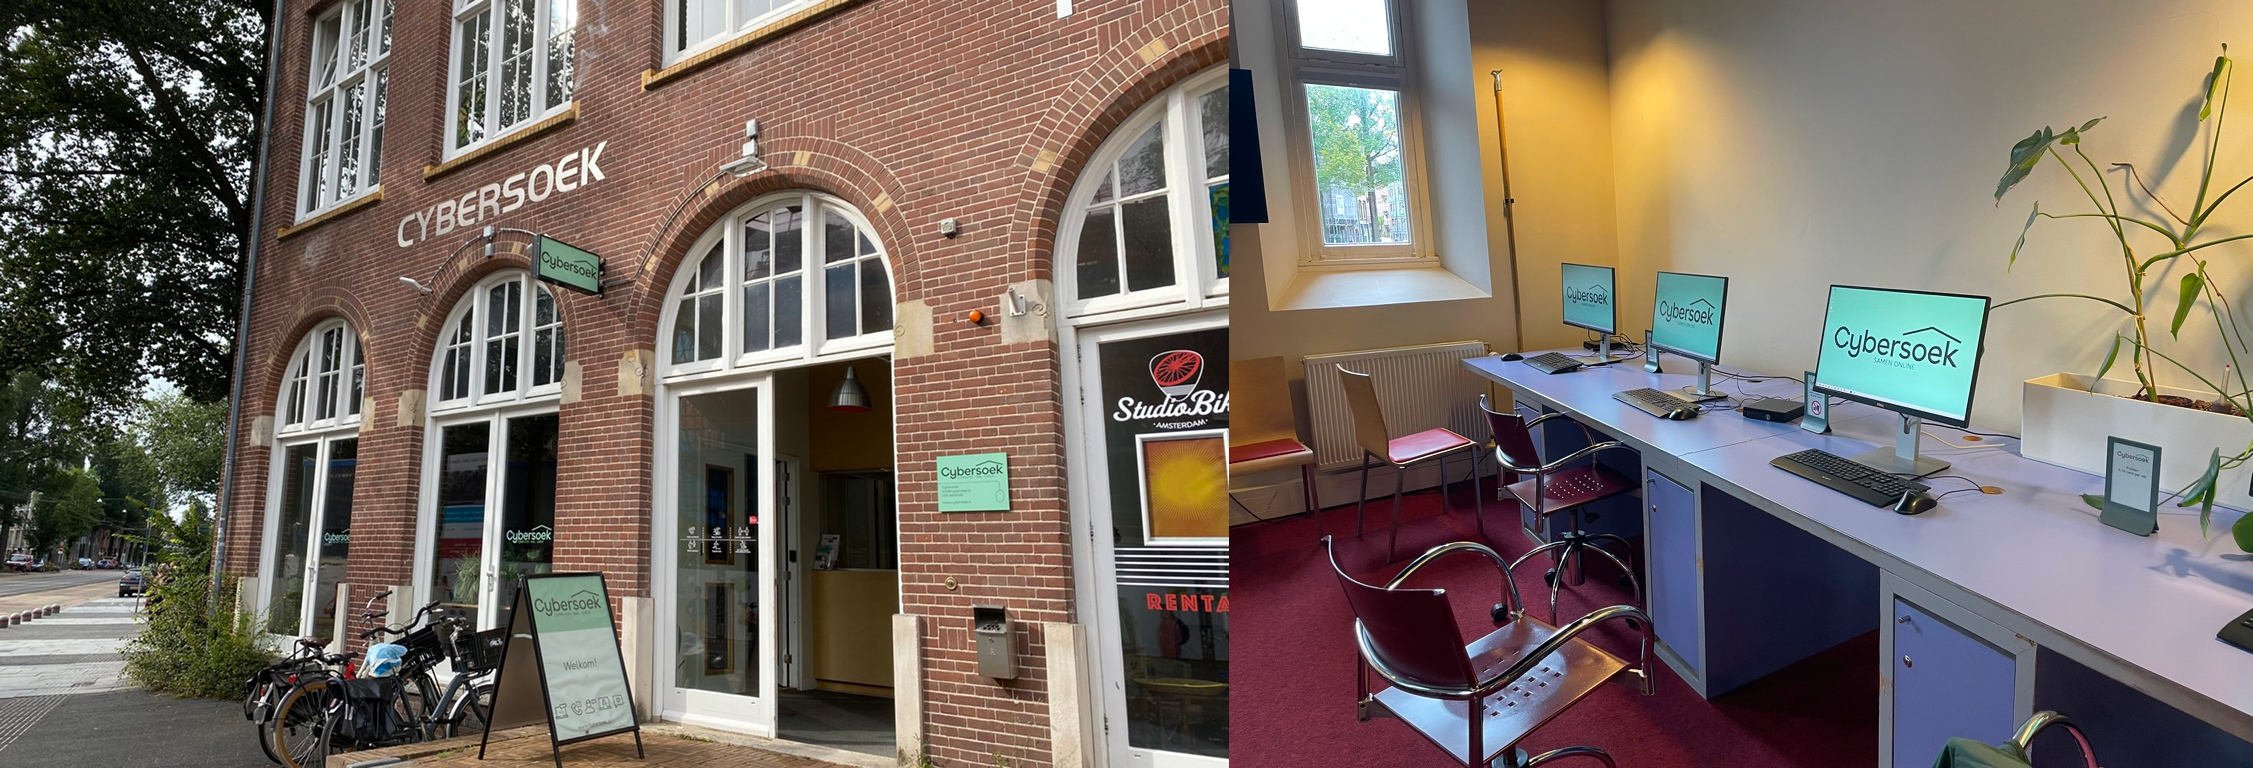
An illustrative example is an article on digital illiteracy. Written by Tim ’s Jongers, the story reports on Cybersoek—an organisation where people who struggle with digital services can go to ask help from volunteers. Their questions range from using social media to applying for social housing to handling banking tasks that are too complex to manage on their own.
For this project, I researched and conceptualised ways in which infographics could enrich the story and help convey its core issue more clearly to the public.
Research
My process begins with reading and analysing a story to identify potential opportunities for infographics. These can take many forms—ranging from reinforcing the core message through data visualisation to offering a fresh perspective that is more effectively conveyed visually than through text alone. These ideas are always discussed collaboratively with the story’s author.
Once I share my initial concepts, I dive into research and gather the data needed to develop the infographic. This includes reviewing reports from government and independent organisations, reading academic papers, and interviewing relevant experts.
Example case – Digital Illiteracy 2/3
This story offered many possibilities for elements that could be translated into visuals—there was plenty of available data on digital literacy, such as the number of people who are digitally illiterate. But what felt more compelling was finding a way to communicate what it is actually like for someone who struggles to navigate digital services. The goal was to give the audience insight into that experience and to show how stressful and disempowering it can be.
To deepen my understanding, I interviewed Karien Sondervan, the director of Cybersoek. She provided detailed insights into the experiences of the people who visit the organisation and the kinds of questions they bring. She also pointed me toward additional sources, allowing me to explore more cases, data, and context.
Conceptualisation
After collecting all the relevant data, I critically determine what is essential to include in the visualisation, separating core insights from secondary details. I then begin sketching ideas and experimenting with different visual forms, layouts, and ways of presenting information.
Throughout this process, I use a range of tools to create the type of visualisation that best fits the story—such as Figma for layout and structure, Flourish for data visualisations, QGIS for mapping, and more. You can explore my full toolset here.
Example case – Digital Illiteracy 3/3
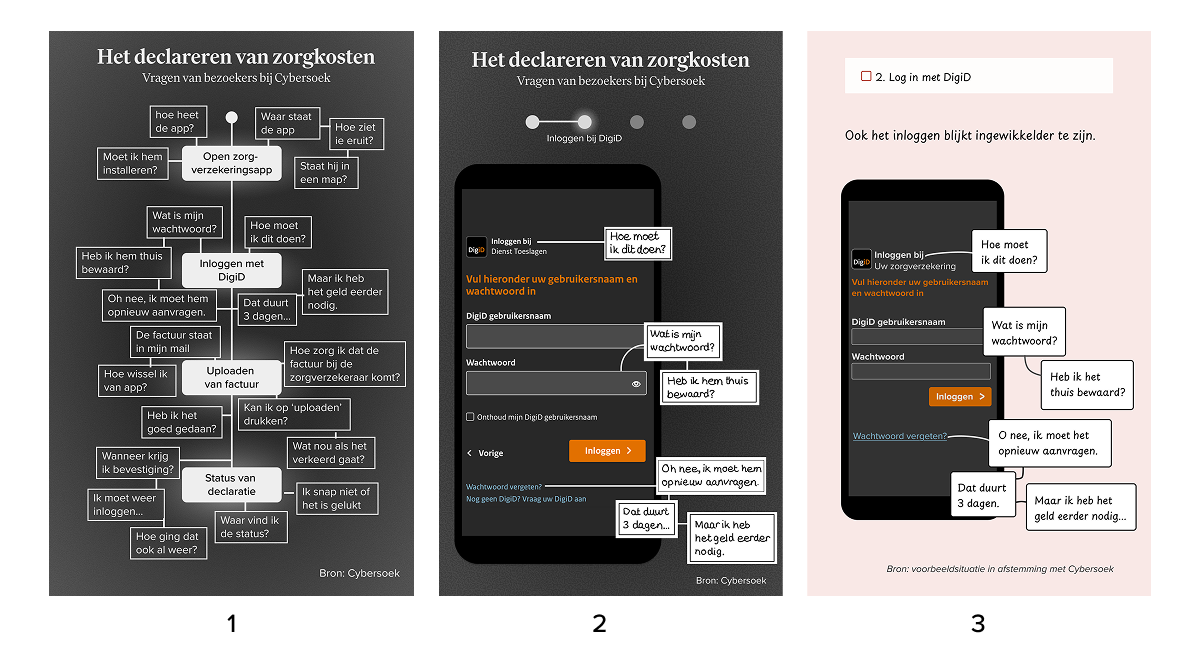
After gathering the necessary data and information, I explored different concepts and visual formats to clearly communicate the experiences of Cybersoek’s visitors. This came with several challenges. It was important to strike a balance between presenting a story that accurately represents the broader group of people who seek help, while also diving deeply into a specific case so that their struggles become tangible, understandable, and accessible to the audience.
The visualisation I created allows the audience to follow, step by step, the process a digitally illiterate person goes through when trying to use and navigate a digital service. It gives viewers insight into what it feels like to struggle with this experience. This is achieved by showing the interfaces the person encounters at each stage, along with the questions and uncertainties they face.